R代写/R语言代写: R语言作图训练
R代写/R语言代写: 这是一个典型的利用R语言自带lib进行R语言作图训练的homework
Homework 6: Data frames and ggplot2 Submit your homework to blackboard by Thursday 6:30 pm to be eligible for the extra credit. Your homework file should be titled lastname_firstname_hw6.R Data frames. Use the diamonds data frame from the ggplot2 library to help you write the following functions.
1. Write a function that given a data frame extracts the column names and prints the names one column name per line to the console.
2. Write a function that given a data frame returns the type of each column (numeric, factor, logical, etc.) and prints the type to the console.
3. Write a function that given a data frame will loop through each numeric column and print the name and mean of that column.
4. Write a function that given a data frame will loop through each factor column and prints a frequency table for that column (Hint: look at the table() function).
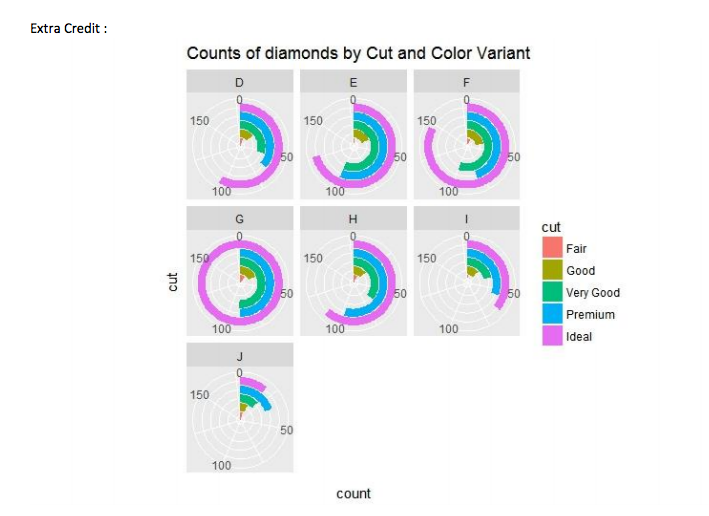
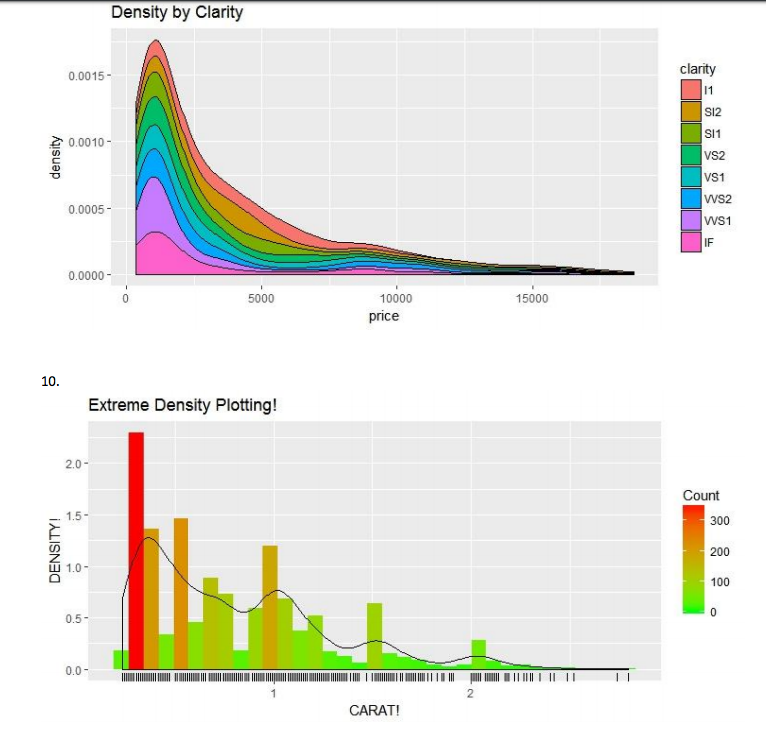
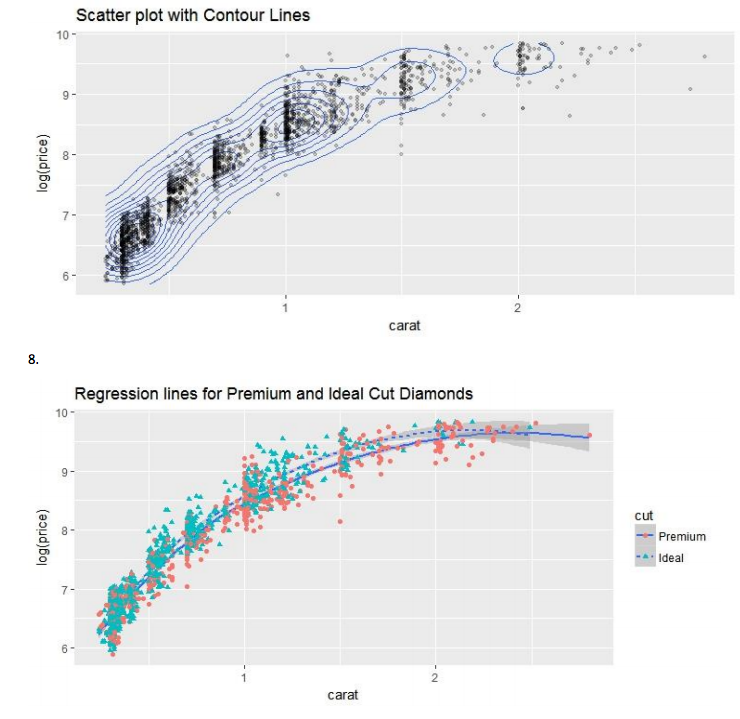
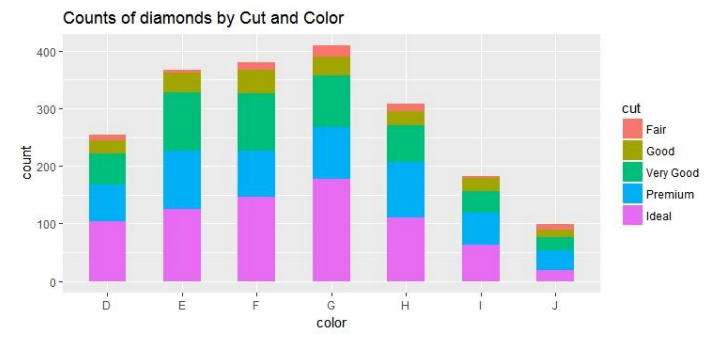
5. Write a function that given a data frame will loop through each column and print the column name, the most common element and the number of times that element occurs. Note: If there are multiple elements that appear the same number of times only return one of them. ggplot2 Recreate the following plots as best you can using ggplot2 and the diamonds data set. Using: set.seed(123) d <- diamonds[sample(nrow(diamonds),2000),] 6. 7. 8. 9. 10. Extra Credit :